- Canton Champion Fibre Company (2308)
- Cherokee Traditions (292)
- Civil War in Southern Appalachia (165)
- Craft Revival (1942)
- Great Smoky Mountains - A Park for America (2766)
- Highlights from Western Carolina University (430)
- Horace Kephart (941)
- Journeys Through Jackson (154)
- LGBTQIA+ Archive of Jackson County (85)
- Oral Histories of Western North Carolina (314)
- Picturing Appalachia (6772)
- Stories of Mountain Folk (413)
- Travel Western North Carolina (160)
- Western Carolina University Fine Art Museum Vitreograph Collection (129)
- Western Carolina University Herbarium (92)
- Western Carolina University: Making Memories (708)
- Western Carolina University Publications (2283)
- Western Carolina University Restricted Electronic Theses and Dissertations (146)
- Western North Carolina Regional Maps (71)
- World War II in Southern Appalachia (131)
- Allanstand Cottage Industries (62)
- Appalachian National Park Association (53)
- Bennett, Kelly, 1890-1974 (1388)
- Berry, Walter (76)
- Brasstown Carvers (40)
- Carver, George Washington, 1864?-1943 (26)
- Cathey, Joseph, 1803-1874 (1)
- Champion Fibre Company (233)
- Champion Paper and Fibre Company (297)
- Cherokee Indian Fair Association (16)
- Cherokee Language Program (22)
- Crowe, Amanda (40)
- Edmonston, Thomas Benton, 1842-1907 (7)
- Ensley, A. L. (Abraham Lincoln), 1865-1948 (275)
- Fromer, Irving Rhodes, 1913-1994 (70)
- George Butz (BFS 1907) (46)
- Goodrich, Frances Louisa (120)
- Grant, George Alexander, 1891-1964 (96)
- Heard, Marian Gladys (60)
- Kephart, Calvin, 1883-1969 (15)
- Kephart, Horace, 1862-1931 (313)
- Kephart, Laura, 1862-1954 (39)
- Laney, Gideon Thomas, 1889-1976 (439)
- Masa, George, 1881-1933 (61)
- McElhinney, William Julian, 1896-1953 (44)
- Niggli, Josephina, 1910-1983 (10)
- North Carolina Park Commission (105)
- Osborne, Kezia Stradley (9)
- Owens, Samuel Robert, 1918-1995 (11)
- Penland Weavers and Potters (36)
- Roberts, Vivienne (15)
- Roth, Albert, 1890-1974 (142)
- Schenck, Carl Alwin, 1868-1955 (1)
- Sherrill's Photography Studio (2565)
- Southern Highland Handicraft Guild (127)
- Southern Highlanders, Inc. (71)
- Stalcup, Jesse Bryson (46)
- Stearns, I. K. (213)
- Thompson, James Edward, 1880-1976 (226)
- United States. Indian Arts and Crafts Board (130)
- USFS (683)
- Vance, Zebulon Baird, 1830-1894 (1)
- Weaver, Zebulon, 1872-1948 (58)
- Western Carolina College (230)
- Western Carolina Teachers College (282)
- Western Carolina University (1794)
- Western Carolina University. Mountain Heritage Center (18)
- Whitman, Walt, 1819-1892 (10)
- Wilburn, Hiram Coleman, 1880-1967 (73)
- Williams, Isadora (3)
- Cain, Doreyl Ammons (0)
- Crittenden, Lorraine (0)
- Rhodes, Judy (0)
- Smith, Edward Clark (0)
- Appalachian Region, Southern (2569)
- Asheville (N.C.) (1923)
- Avery County (N.C.) (26)
- Blount County (Tenn.) (161)
- Buncombe County (N.C.) (1672)
- Cherokee County (N.C.) (283)
- Clay County (N.C.) (555)
- Graham County (N.C.) (233)
- Great Smoky Mountains National Park (N.C. and Tenn.) (519)
- Haywood County (N.C.) (3524)
- Henderson County (N.C.) (70)
- Jackson County (N.C.) (4694)
- Knox County (Tenn.) (25)
- Knoxville (Tenn.) (12)
- Lake Santeetlah (N.C.) (10)
- Macon County (N.C.) (420)
- Madison County (N.C.) (212)
- McDowell County (N.C.) (39)
- Mitchell County (N.C.) (132)
- Polk County (N.C.) (35)
- Qualla Boundary (981)
- Rutherford County (N.C.) (76)
- Swain County (N.C.) (2115)
- Transylvania County (N.C.) (270)
- Watauga County (N.C.) (12)
- Waynesville (N.C.) (84)
- Yancey County (N.C.) (72)
- Aerial Photographs (3)
- Aerial Views (60)
- Albums (books) (4)
- Articles (1)
- Artifacts (object Genre) (228)
- Bibliographies (1)
- Biography (general Genre) (2)
- Cards (information Artifacts) (38)
- Clippings (information Artifacts) (191)
- Crafts (art Genres) (622)
- Depictions (visual Works) (21)
- Design Drawings (1)
- Drawings (visual Works) (184)
- Envelopes (73)
- Facsimiles (reproductions) (1)
- Fiction (general Genre) (4)
- Financial Records (12)
- Fliers (printed Matter) (67)
- Glass Plate Negatives (381)
- Guidebooks (2)
- Internegatives (10)
- Interviews (815)
- Land Surveys (102)
- Letters (correspondence) (1013)
- Manuscripts (documents) (618)
- Maps (documents) (177)
- Memorandums (25)
- Minutes (administrative Records) (59)
- Negatives (photographs) (5835)
- Newsletters (1285)
- Newspapers (2)
- Occupation Currency (1)
- Paintings (visual Works) (1)
- Pen And Ink Drawings (1)
- Periodicals (193)
- Personal Narratives (10)
- Photographs (12976)
- Plans (maps) (1)
- Poetry (6)
- Portraits (4533)
- Postcards (329)
- Programs (documents) (151)
- Publications (documents) (2236)
- Questionnaires (65)
- Scrapbooks (282)
- Sheet Music (2)
- Slides (photographs) (402)
- Songs (musical Compositions) (2)
- Sound Recordings (796)
- Specimens (92)
- Speeches (documents) (15)
- Tintypes (photographs) (8)
- Transcripts (322)
- Video Recordings (physical Artifacts) (23)
- Vitreographs (129)
- Text Messages (0)
- A.L. Ensley Collection (275)
- Appalachian Industrial School Records (7)
- Appalachian National Park Association Records (336)
- Axley-Meroney Collection (2)
- Bayard Wootten Photograph Collection (20)
- Bethel Rural Community Organization Collection (7)
- Blumer Collection (5)
- C.W. Slagle Collection (20)
- Canton Area Historical Museum (2110)
- Carlos C. Campbell Collection (282)
- Cataloochee History Project (64)
- Cherokee Studies Collection (4)
- Daisy Dame Photograph Album (5)
- Daniel Boone VI Collection (1)
- Doris Ulmann Photograph Collection (112)
- Elizabeth H. Lasley Collection (1)
- Elizabeth Woolworth Szold Fleharty Collection (4)
- Frank Fry Collection (95)
- George Masa Collection (173)
- Gideon Laney Collection (452)
- Hazel Scarborough Collection (2)
- Hiram C. Wilburn Papers (28)
- Historic Photographs Collection (236)
- Horace Kephart Collection (861)
- Humbard Collection (33)
- Hunter and Weaver Families Collection (1)
- I. D. Blumenthal Collection (4)
- Isadora Williams Collection (4)
- Jesse Bryson Stalcup Collection (47)
- Jim Thompson Collection (224)
- John B. Battle Collection (7)
- John C. Campbell Folk School Records (80)
- John Parris Collection (6)
- Judaculla Rock project (2)
- Kelly Bennett Collection (1407)
- Love Family Papers (11)
- Major Wiley Parris Civil War Letters (3)
- Map Collection (12)
- McFee-Misemer Civil War Letters (34)
- Mountain Heritage Center Collection (4)
- Norburn - Robertson - Thomson Families Collection (44)
- Pauline Hood Collection (7)
- Pre-Guild Collection (2)
- Qualla Arts and Crafts Mutual Collection (12)
- R.A. Romanes Collection (681)
- Rosser H. Taylor Collection (1)
- Samuel Robert Owens Collection (94)
- Sara Madison Collection (144)
- Sherrill Studio Photo Collection (2558)
- Smoky Mountains Hiking Club Collection (616)
- Stories of Mountain Folk - Radio Programs (374)
- The Reporter, Western Carolina University (510)
- Venoy and Elizabeth Reed Collection (16)
- WCU Gender and Sexuality Oral History Project (32)
- WCU Mountain Heritage Center Oral Histories (25)
- WCU Oral History Collection - Mountain People, Mountain Lives (71)
- WCU Students Newspapers Collection (1744)
- Western North Carolina Tomorrow Black Oral History Project (69)
- William Williams Stringfield Collection (2)
- Zebulon Weaver Collection (109)
- African Americans (390)
- Appalachian Trail (35)
- Artisans (521)
- Cherokee art (84)
- Cherokee artists -- North Carolina (10)
- Cherokee language (21)
- Cherokee pottery (101)
- Cherokee women (208)
- Church buildings (170)
- Civilian Conservation Corps (U.S.) (110)
- College student newspapers and periodicals (1830)
- Dams (107)
- Dance (1023)
- Education (222)
- Floods (61)
- Folk music (1015)
- Forced removal, 1813-1903 (2)
- Forest conservation (220)
- Forests and forestry (1184)
- Gender nonconformity (4)
- Great Smoky Mountains National Park (N.C. and Tenn.) (181)
- Hunting (38)
- Landscape photography (25)
- Logging (118)
- Maps (83)
- Mines and mineral resources (8)
- North Carolina -- Maps (18)
- Paper industry (38)
- Postcards (255)
- Pottery (135)
- Railroad trains (71)
- Rural electrification -- North Carolina, Western (3)
- School integration -- Southern States (2)
- Segregation -- North Carolina, Western (5)
- Slavery (5)
- Sports (452)
- Storytelling (244)
- Waterfalls -- Great Smoky Mountains (N.C. and Tenn.) (66)
- Weaving -- Appalachian Region, Southern (280)
- Wood-carving -- Appalachian Region, Southern (328)
- World War, 1939-1945 (173)
Report of the Secretary of Agriculture in relation to the forests, rivers, and mountains of the southern Appalachian region

Report of the Secretary of Agriculture in relation to the forests, rivers, and mountains of the southern Appalachian region
HL_SD143-U5_000_a
Report of the Secretary of Agriculture in relation to the forests, rivers, and mountains of the southern Appalachian region
HL_SD143-U5_000_b
Report of the Secretary of Agriculture in relation to the forests, rivers, and mountains of the southern Appalachian region
HL_SD143-U5_000_c
Report of the Secretary of Agriculture in relation to the forests, rivers, and mountains of the southern Appalachian region
HL_SD143-U5_000_d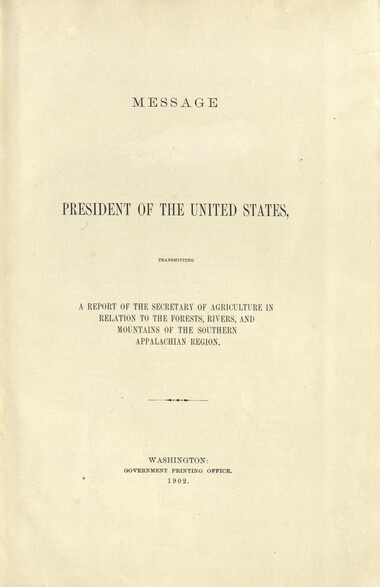
Report of the Secretary of Agriculture in relation to the forests, rivers, and mountains of the southern Appalachian region
HL_SD143-U5_001
Report of the Secretary of Agriculture in relation to the forests, rivers, and mountains of the southern Appalachian region
HL_SD143-U5_002
Report of the Secretary of Agriculture in relation to the forests, rivers, and mountains of the southern Appalachian region
HL_SD143-U5_003
Report of the Secretary of Agriculture in relation to the forests, rivers, and mountains of the southern Appalachian region
HL_SD143-U5_004
Report of the Secretary of Agriculture in relation to the forests, rivers, and mountains of the southern Appalachian region
HL_SD143-U5_005
Report of the Secretary of Agriculture in relation to the forests, rivers, and mountains of the southern Appalachian region
HL_SD143-U5_006
Report of the Secretary of Agriculture in relation to the forests, rivers, and mountains of the southern Appalachian region
HL_SD143-U5_007
Report of the Secretary of Agriculture in relation to the forests, rivers, and mountains of the southern Appalachian region
HL_SD143-U5_008
Report of the Secretary of Agriculture in relation to the forests, rivers, and mountains of the southern Appalachian region
HL_SD143-U5_009
Report of the Secretary of Agriculture in relation to the forests, rivers, and mountains of the southern Appalachian region
HL_SD143-U5_010
Report of the Secretary of Agriculture in relation to the forests, rivers, and mountains of the southern Appalachian region
HL_SD143-U5_011
Report of the Secretary of Agriculture in relation to the forests, rivers, and mountains of the southern Appalachian region
HL_SD143-U5_012
Report of the Secretary of Agriculture in relation to the forests, rivers, and mountains of the southern Appalachian region
HL_SD143-U5_013
Report of the Secretary of Agriculture in relation to the forests, rivers, and mountains of the southern Appalachian region
HL_SD143-U5_014
Report of the Secretary of Agriculture in relation to the forests, rivers, and mountains of the southern Appalachian region
HL_SD143-U5_014_I_a
Report of the Secretary of Agriculture in relation to the forests, rivers, and mountains of the southern Appalachian region
HL_SD143-U5_014_I_b
Report of the Secretary of Agriculture in relation to the forests, rivers, and mountains of the southern Appalachian region
HL_SD143-U5_014_II_a
Report of the Secretary of Agriculture in relation to the forests, rivers, and mountains of the southern Appalachian region
HL_SD143-U5_014_II_b
Report of the Secretary of Agriculture in relation to the forests, rivers, and mountains of the southern Appalachian region
HL_SD143-U5_015
Report of the Secretary of Agriculture in relation to the forests, rivers, and mountains of the southern Appalachian region
HL_SD143-U5_016
Report of the Secretary of Agriculture in relation to the forests, rivers, and mountains of the southern Appalachian region
HL_SD143-U5_016_III_a
Report of the Secretary of Agriculture in relation to the forests, rivers, and mountains of the southern Appalachian region
HL_SD143-U5_016_III_b
Report of the Secretary of Agriculture in relation to the forests, rivers, and mountains of the southern Appalachian region
HL_SD143-U5_016_IV_a
Report of the Secretary of Agriculture in relation to the forests, rivers, and mountains of the southern Appalachian region
HL_SD143-U5_016_IV_b
Report of the Secretary of Agriculture in relation to the forests, rivers, and mountains of the southern Appalachian region
HL_SD143-U5_017
Report of the Secretary of Agriculture in relation to the forests, rivers, and mountains of the southern Appalachian region
HL_SD143-U5_018
Report of the Secretary of Agriculture in relation to the forests, rivers, and mountains of the southern Appalachian region
HL_SD143-U5_018_V_a
Report of the Secretary of Agriculture in relation to the forests, rivers, and mountains of the southern Appalachian region
HL_SD143-U5_018_VI-1a
Report of the Secretary of Agriculture in relation to the forests, rivers, and mountains of the southern Appalachian region
HL_SD143-U5_018_VI-1b
Report of the Secretary of Agriculture in relation to the forests, rivers, and mountains of the southern Appalachian region
HL_SD143-U5_018_VI-1c
Report of the Secretary of Agriculture in relation to the forests, rivers, and mountains of the southern Appalachian region
HL_SD143-U5_018_VI-1d
Report of the Secretary of Agriculture in relation to the forests, rivers, and mountains of the southern Appalachian region
HL_SD143-U5_018_VI-1e
Report of the Secretary of Agriculture in relation to the forests, rivers, and mountains of the southern Appalachian region
HL_SD143-U5_018_VI-2a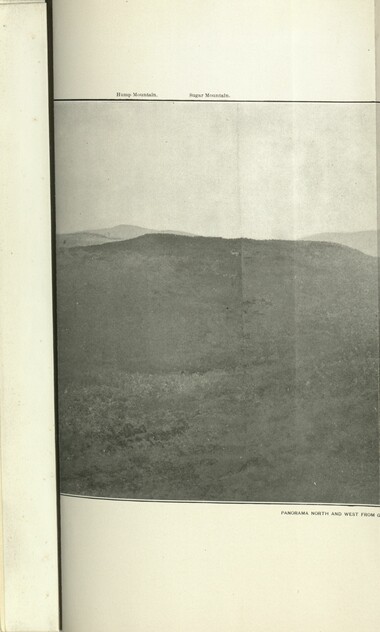
Report of the Secretary of Agriculture in relation to the forests, rivers, and mountains of the southern Appalachian region
HL_SD143-U5_018_VI-2b
Report of the Secretary of Agriculture in relation to the forests, rivers, and mountains of the southern Appalachian region
HL_SD143-U5_018_VI-2c
Report of the Secretary of Agriculture in relation to the forests, rivers, and mountains of the southern Appalachian region
HL_SD143-U5_018_VI-2d
Report of the Secretary of Agriculture in relation to the forests, rivers, and mountains of the southern Appalachian region
HL_SD143-U5_018_VI-2e
Report of the Secretary of Agriculture in relation to the forests, rivers, and mountains of the southern Appalachian region
HL_SD143-U5_018_VI-2f
Report of the Secretary of Agriculture in relation to the forests, rivers, and mountains of the southern Appalachian region
HL_SD143-U5_019
Report of the Secretary of Agriculture in relation to the forests, rivers, and mountains of the southern Appalachian region
HL_SD143-U5_020
Report of the Secretary of Agriculture in relation to the forests, rivers, and mountains of the southern Appalachian region
HL_SD143-U5_020_VII_a
Report of the Secretary of Agriculture in relation to the forests, rivers, and mountains of the southern Appalachian region
HL_SD143-U5_020_VII_b
Report of the Secretary of Agriculture in relation to the forests, rivers, and mountains of the southern Appalachian region
HL_SD143-U5_020_VIII_a
Report of the Secretary of Agriculture in relation to the forests, rivers, and mountains of the southern Appalachian region
HL_SD143-U5_020_VIII_b
Report of the Secretary of Agriculture in relation to the forests, rivers, and mountains of the southern Appalachian region
HL_SD143-U5_021
Report of the Secretary of Agriculture in relation to the forests, rivers, and mountains of the southern Appalachian region
HL_SD143-U5_022
Report of the Secretary of Agriculture in relation to the forests, rivers, and mountains of the southern Appalachian region
HL_SD143-U5_022_IXA_a
Report of the Secretary of Agriculture in relation to the forests, rivers, and mountains of the southern Appalachian region
HL_SD143-U5_022_IXA_b
Report of the Secretary of Agriculture in relation to the forests, rivers, and mountains of the southern Appalachian region
HL_SD143-U5_022_IXB_a
Report of the Secretary of Agriculture in relation to the forests, rivers, and mountains of the southern Appalachian region
HL_SD143-U5_022_IXB_b
Report of the Secretary of Agriculture in relation to the forests, rivers, and mountains of the southern Appalachian region
HL_SD143-U5_022_X_a
Report of the Secretary of Agriculture in relation to the forests, rivers, and mountains of the southern Appalachian region
HL_SD143-U5_022_X_b
Report of the Secretary of Agriculture in relation to the forests, rivers, and mountains of the southern Appalachian region
HL_SD143-U5_022_XI_a
Report of the Secretary of Agriculture in relation to the forests, rivers, and mountains of the southern Appalachian region
HL_SD143-U5_022_XI_b
Report of the Secretary of Agriculture in relation to the forests, rivers, and mountains of the southern Appalachian region
HL_SD143-U5_023
Report of the Secretary of Agriculture in relation to the forests, rivers, and mountains of the southern Appalachian region
HL_SD143-U5_024
Report of the Secretary of Agriculture in relation to the forests, rivers, and mountains of the southern Appalachian region
HL_SD143-U5_024_XII_a
Report of the Secretary of Agriculture in relation to the forests, rivers, and mountains of the southern Appalachian region
HL_SD143-U5_024_XII_b
Report of the Secretary of Agriculture in relation to the forests, rivers, and mountains of the southern Appalachian region
HL_SD143-U5_024_XIII_a
Report of the Secretary of Agriculture in relation to the forests, rivers, and mountains of the southern Appalachian region
HL_SD143-U5_024_XIII_b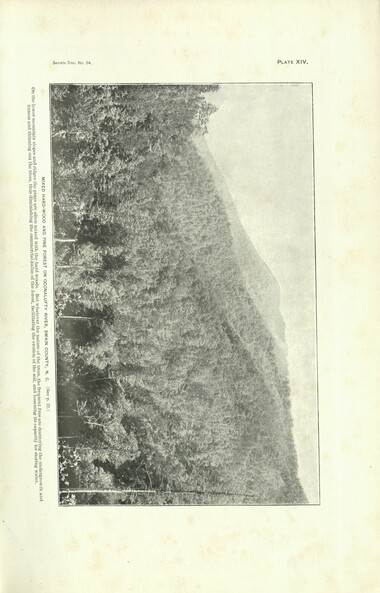
Report of the Secretary of Agriculture in relation to the forests, rivers, and mountains of the southern Appalachian region
HL_SD143-U5_024_XIV_a
Report of the Secretary of Agriculture in relation to the forests, rivers, and mountains of the southern Appalachian region
HL_SD143-U5_024_XIV_b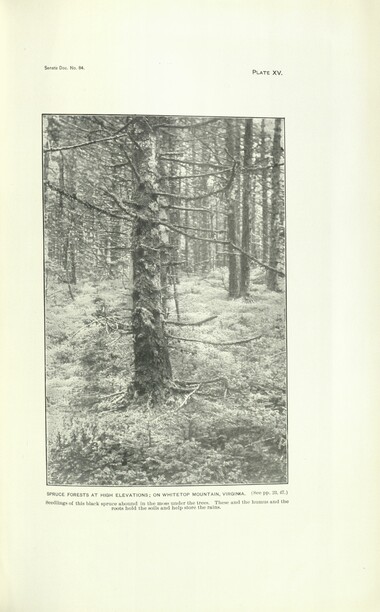
Report of the Secretary of Agriculture in relation to the forests, rivers, and mountains of the southern Appalachian region
HL_SD143-U5_024_XV_a
Report of the Secretary of Agriculture in relation to the forests, rivers, and mountains of the southern Appalachian region
HL_SD143-U5_024_XV_b
Report of the Secretary of Agriculture in relation to the forests, rivers, and mountains of the southern Appalachian region
HL_SD143-U5_025
Report of the Secretary of Agriculture in relation to the forests, rivers, and mountains of the southern Appalachian region
HL_SD143-U5_026
Report of the Secretary of Agriculture in relation to the forests, rivers, and mountains of the southern Appalachian region
HL_SD143-U5_026_XVI_a
Report of the Secretary of Agriculture in relation to the forests, rivers, and mountains of the southern Appalachian region
HL_SD143-U5_026_XVI_b
Report of the Secretary of Agriculture in relation to the forests, rivers, and mountains of the southern Appalachian region
HL_SD143-U5_026_XVII_a
Report of the Secretary of Agriculture in relation to the forests, rivers, and mountains of the southern Appalachian region
HL_SD143-U5_026_XVII_b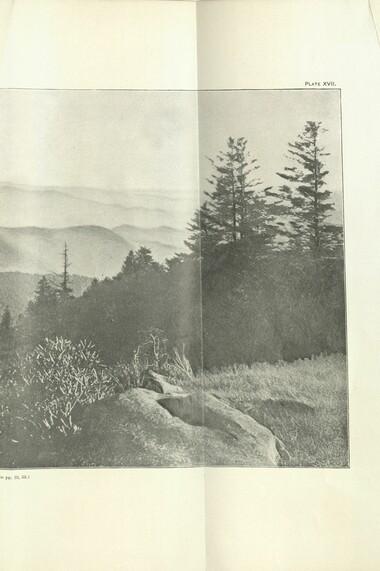
Report of the Secretary of Agriculture in relation to the forests, rivers, and mountains of the southern Appalachian region
HL_SD143-U5_026_XVII_c
Report of the Secretary of Agriculture in relation to the forests, rivers, and mountains of the southern Appalachian region
HL_SD143-U5_026_XVII_d
Report of the Secretary of Agriculture in relation to the forests, rivers, and mountains of the southern Appalachian region
HL_SD143-U5_026_XVIII_a
Report of the Secretary of Agriculture in relation to the forests, rivers, and mountains of the southern Appalachian region
HL_SD143-U5_026_XVIII_b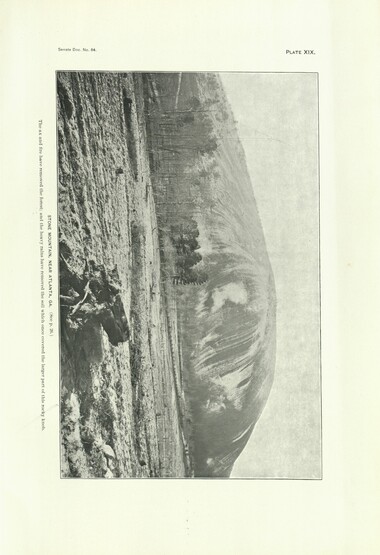
Report of the Secretary of Agriculture in relation to the forests, rivers, and mountains of the southern Appalachian region
HL_SD143-U5_026_XIX_a
Report of the Secretary of Agriculture in relation to the forests, rivers, and mountains of the southern Appalachian region
HL_SD143-U5_026_XIX_b
Report of the Secretary of Agriculture in relation to the forests, rivers, and mountains of the southern Appalachian region
HL_SD143-U5_026_XX_a
Report of the Secretary of Agriculture in relation to the forests, rivers, and mountains of the southern Appalachian region
HL_SD143-U5_026_XX_b
Report of the Secretary of Agriculture in relation to the forests, rivers, and mountains of the southern Appalachian region
HL_SD143-U5_027
Report of the Secretary of Agriculture in relation to the forests, rivers, and mountains of the southern Appalachian region
HL_SD143-U5_028
Report of the Secretary of Agriculture in relation to the forests, rivers, and mountains of the southern Appalachian region
HL_SD143-U5_028_XXI_a
Report of the Secretary of Agriculture in relation to the forests, rivers, and mountains of the southern Appalachian region
HL_SD143-U5_028_XXI_b
Report of the Secretary of Agriculture in relation to the forests, rivers, and mountains of the southern Appalachian region
HL_SD143-U5_028_XXII_a
Report of the Secretary of Agriculture in relation to the forests, rivers, and mountains of the southern Appalachian region
HL_SD143-U5_028_XXII_b
Report of the Secretary of Agriculture in relation to the forests, rivers, and mountains of the southern Appalachian region
HL_SD143-U5_028_XXIII_a
Report of the Secretary of Agriculture in relation to the forests, rivers, and mountains of the southern Appalachian region
HL_SD143-U5_028_XXIII_b
Report of the Secretary of Agriculture in relation to the forests, rivers, and mountains of the southern Appalachian region
HL_SD143-U5_028_XXIV_a
Report of the Secretary of Agriculture in relation to the forests, rivers, and mountains of the southern Appalachian region
HL_SD143-U5_028_XXIV_b
Report of the Secretary of Agriculture in relation to the forests, rivers, and mountains of the southern Appalachian region
HL_SD143-U5_029
Report of the Secretary of Agriculture in relation to the forests, rivers, and mountains of the southern Appalachian region
HL_SD143-U5_030
Report of the Secretary of Agriculture in relation to the forests, rivers, and mountains of the southern Appalachian region
HL_SD143-U5_030_XXV_a
Report of the Secretary of Agriculture in relation to the forests, rivers, and mountains of the southern Appalachian region
HL_SD143-U5_030_XXV_b
Report of the Secretary of Agriculture in relation to the forests, rivers, and mountains of the southern Appalachian region
HL_SD143-U5_030_XXVI_a
Report of the Secretary of Agriculture in relation to the forests, rivers, and mountains of the southern Appalachian region
HL_SD143-U5_030_XXVI_b
Report of the Secretary of Agriculture in relation to the forests, rivers, and mountains of the southern Appalachian region
HL_SD143-U5_030_XXVII_a
Report of the Secretary of Agriculture in relation to the forests, rivers, and mountains of the southern Appalachian region
HL_SD143-U5_030_XXVII_b
Report of the Secretary of Agriculture in relation to the forests, rivers, and mountains of the southern Appalachian region
HL_SD143-U5_030_XXVIII_a
Report of the Secretary of Agriculture in relation to the forests, rivers, and mountains of the southern Appalachian region
HL_SD143-U5_030_XXVIII_b
Report of the Secretary of Agriculture in relation to the forests, rivers, and mountains of the southern Appalachian region
HL_SD143-U5_031
Report of the Secretary of Agriculture in relation to the forests, rivers, and mountains of the southern Appalachian region
HL_SD143-U5_032
Report of the Secretary of Agriculture in relation to the forests, rivers, and mountains of the southern Appalachian region
HL_SD143-U5_032_XXIX_a
Report of the Secretary of Agriculture in relation to the forests, rivers, and mountains of the southern Appalachian region
HL_SD143-U5_032_XXIX_b
Report of the Secretary of Agriculture in relation to the forests, rivers, and mountains of the southern Appalachian region
HL_SD143-U5_032_XXX_a
Report of the Secretary of Agriculture in relation to the forests, rivers, and mountains of the southern Appalachian region
HL_SD143-U5_032_XXX_b
Report of the Secretary of Agriculture in relation to the forests, rivers, and mountains of the southern Appalachian region
HL_SD143-U5_032_XXXI_a
Report of the Secretary of Agriculture in relation to the forests, rivers, and mountains of the southern Appalachian region
HL_SD143-U5_032_XXXI_b
Report of the Secretary of Agriculture in relation to the forests, rivers, and mountains of the southern Appalachian region
HL_SD143-U5_032_XXXII_a
Report of the Secretary of Agriculture in relation to the forests, rivers, and mountains of the southern Appalachian region
HL_SD143-U5_032_XXXII_b
Report of the Secretary of Agriculture in relation to the forests, rivers, and mountains of the southern Appalachian region
HL_SD143-U5_033
Report of the Secretary of Agriculture in relation to the forests, rivers, and mountains of the southern Appalachian region
HL_SD143-U5_034
Report of the Secretary of Agriculture in relation to the forests, rivers, and mountains of the southern Appalachian region
HL_SD143-U5_034_XXXIII_a
Report of the Secretary of Agriculture in relation to the forests, rivers, and mountains of the southern Appalachian region
HL_SD143-U5_034_XXXIII_b
Report of the Secretary of Agriculture in relation to the forests, rivers, and mountains of the southern Appalachian region
HL_SD143-U5_034_XXXIV_a
Report of the Secretary of Agriculture in relation to the forests, rivers, and mountains of the southern Appalachian region
HL_SD143-U5_034_XXXIV_b
Report of the Secretary of Agriculture in relation to the forests, rivers, and mountains of the southern Appalachian region
HL_SD143-U5_034_XXXV_a
Report of the Secretary of Agriculture in relation to the forests, rivers, and mountains of the southern Appalachian region
HL_SD143-U5_034_XXXV_b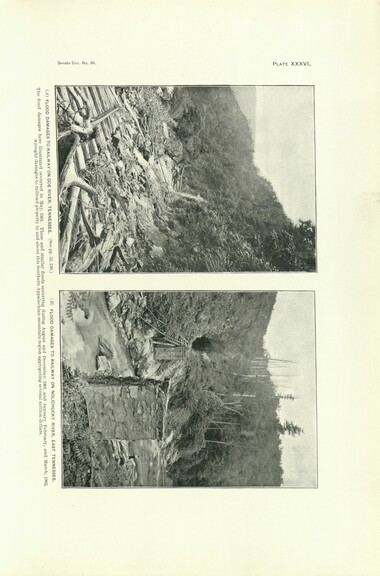
Report of the Secretary of Agriculture in relation to the forests, rivers, and mountains of the southern Appalachian region
HL_SD143-U5_034_XXXVI_a
Report of the Secretary of Agriculture in relation to the forests, rivers, and mountains of the southern Appalachian region
HL_SD143-U5_034_XXXVI_b
Report of the Secretary of Agriculture in relation to the forests, rivers, and mountains of the southern Appalachian region
HL_SD143-U5_035
Report of the Secretary of Agriculture in relation to the forests, rivers, and mountains of the southern Appalachian region
HL_SD143-U5_036
Report of the Secretary of Agriculture in relation to the forests, rivers, and mountains of the southern Appalachian region
HL_SD143-U5_037
Report of the Secretary of Agriculture in relation to the forests, rivers, and mountains of the southern Appalachian region
HL_SD143-U5_038
Report of the Secretary of Agriculture in relation to the forests, rivers, and mountains of the southern Appalachian region
HL_SD143-U5_039
Report of the Secretary of Agriculture in relation to the forests, rivers, and mountains of the southern Appalachian region
HL_SD143-U5_040
Report of the Secretary of Agriculture in relation to the forests, rivers, and mountains of the southern Appalachian region
HL_SD143-U5_041
Report of the Secretary of Agriculture in relation to the forests, rivers, and mountains of the southern Appalachian region
HL_SD143-U5_042
Report of the Secretary of Agriculture in relation to the forests, rivers, and mountains of the southern Appalachian region
HL_SD143-U5_043
Report of the Secretary of Agriculture in relation to the forests, rivers, and mountains of the southern Appalachian region
HL_SD143-U5_044
Report of the Secretary of Agriculture in relation to the forests, rivers, and mountains of the southern Appalachian region
HL_SD143-U5_045
Report of the Secretary of Agriculture in relation to the forests, rivers, and mountains of the southern Appalachian region
HL_SD143-U5_046
Report of the Secretary of Agriculture in relation to the forests, rivers, and mountains of the southern Appalachian region
HL_SD143-U5_046_XXXVII_a
Report of the Secretary of Agriculture in relation to the forests, rivers, and mountains of the southern Appalachian region
HL_SD143-U5_046_XXXVII_b
Report of the Secretary of Agriculture in relation to the forests, rivers, and mountains of the southern Appalachian region
HL_SD143-U5_046_XXXVIII_a
Report of the Secretary of Agriculture in relation to the forests, rivers, and mountains of the southern Appalachian region
HL_SD143-U5_046_XXXVIII_b
Report of the Secretary of Agriculture in relation to the forests, rivers, and mountains of the southern Appalachian region
HL_SD143-U5_047
Report of the Secretary of Agriculture in relation to the forests, rivers, and mountains of the southern Appalachian region
HL_SD143-U5_048
Report of the Secretary of Agriculture in relation to the forests, rivers, and mountains of the southern Appalachian region
HL_SD143-U5_048_XXXIX_a
Report of the Secretary of Agriculture in relation to the forests, rivers, and mountains of the southern Appalachian region
HL_SD143-U5_048_XXXIX_b
Report of the Secretary of Agriculture in relation to the forests, rivers, and mountains of the southern Appalachian region
HL_SD143-U5_048_XL_a
Report of the Secretary of Agriculture in relation to the forests, rivers, and mountains of the southern Appalachian region
HL_SD143-U5_048_XL_b
Report of the Secretary of Agriculture in relation to the forests, rivers, and mountains of the southern Appalachian region
HL_SD143-U5_049
Report of the Secretary of Agriculture in relation to the forests, rivers, and mountains of the southern Appalachian region
HL_SD143-U5_050
Report of the Secretary of Agriculture in relation to the forests, rivers, and mountains of the southern Appalachian region
HL_SD143-U5_051
Report of the Secretary of Agriculture in relation to the forests, rivers, and mountains of the southern Appalachian region
HL_SD143-U5_052
Report of the Secretary of Agriculture in relation to the forests, rivers, and mountains of the southern Appalachian region
HL_SD143-U5_052_XLI_a
Report of the Secretary of Agriculture in relation to the forests, rivers, and mountains of the southern Appalachian region
HL_SD143-U5_052_XLI_b
Report of the Secretary of Agriculture in relation to the forests, rivers, and mountains of the southern Appalachian region
HL_SD143-U5_052_XLII_a
Report of the Secretary of Agriculture in relation to the forests, rivers, and mountains of the southern Appalachian region
HL_SD143-U5_052_XLII_b
Report of the Secretary of Agriculture in relation to the forests, rivers, and mountains of the southern Appalachian region
HL_SD143-U5_052_XLIII_a
Report of the Secretary of Agriculture in relation to the forests, rivers, and mountains of the southern Appalachian region
HL_SD143-U5_052_XLIII_b
Report of the Secretary of Agriculture in relation to the forests, rivers, and mountains of the southern Appalachian region
HL_SD143-U5_053
Report of the Secretary of Agriculture in relation to the forests, rivers, and mountains of the southern Appalachian region
HL_SD143-U5_054
Report of the Secretary of Agriculture in relation to the forests, rivers, and mountains of the southern Appalachian region
HL_SD143-U5_054_XLIV_a
Report of the Secretary of Agriculture in relation to the forests, rivers, and mountains of the southern Appalachian region
HL_SD143-U5_054_XLIV_b
Report of the Secretary of Agriculture in relation to the forests, rivers, and mountains of the southern Appalachian region
HL_SD143-U5_054_XLV_a
Report of the Secretary of Agriculture in relation to the forests, rivers, and mountains of the southern Appalachian region
HL_SD143-U5_054_XLV_b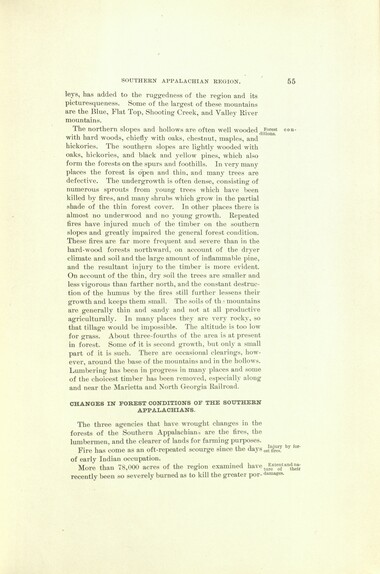
Report of the Secretary of Agriculture in relation to the forests, rivers, and mountains of the southern Appalachian region
HL_SD143-U5_055
Report of the Secretary of Agriculture in relation to the forests, rivers, and mountains of the southern Appalachian region
HL_SD143-U5_056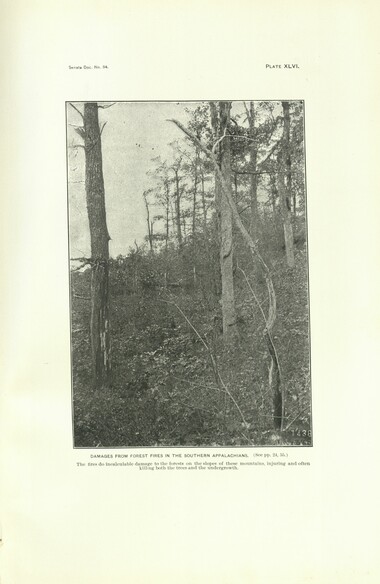
Report of the Secretary of Agriculture in relation to the forests, rivers, and mountains of the southern Appalachian region
HL_SD143-U5_056_XLVI_a
Report of the Secretary of Agriculture in relation to the forests, rivers, and mountains of the southern Appalachian region
HL_SD143-U5_056_XLVI_b
Report of the Secretary of Agriculture in relation to the forests, rivers, and mountains of the southern Appalachian region
HL_SD143-U5_056_XLVII_a
Report of the Secretary of Agriculture in relation to the forests, rivers, and mountains of the southern Appalachian region
HL_SD143-U5_056_XLVII_b
Report of the Secretary of Agriculture in relation to the forests, rivers, and mountains of the southern Appalachian region
HL_SD143-U5_056_XLVIII_a
Report of the Secretary of Agriculture in relation to the forests, rivers, and mountains of the southern Appalachian region
HL_SD143-U5_056_XLVIII_b
Report of the Secretary of Agriculture in relation to the forests, rivers, and mountains of the southern Appalachian region
HL_SD143-U5_056_XLVIX_a
Report of the Secretary of Agriculture in relation to the forests, rivers, and mountains of the southern Appalachian region
HL_SD143-U5_056_XLVIX_b
Report of the Secretary of Agriculture in relation to the forests, rivers, and mountains of the southern Appalachian region
HL_SD143-U5_057
Report of the Secretary of Agriculture in relation to the forests, rivers, and mountains of the southern Appalachian region
HL_SD143-U5_058
Report of the Secretary of Agriculture in relation to the forests, rivers, and mountains of the southern Appalachian region
HL_SD143-U5_059
Report of the Secretary of Agriculture in relation to the forests, rivers, and mountains of the southern Appalachian region
HL_SD143-U5_060
Report of the Secretary of Agriculture in relation to the forests, rivers, and mountains of the southern Appalachian region
HL_SD143-U5_061
Report of the Secretary of Agriculture in relation to the forests, rivers, and mountains of the southern Appalachian region
HL_SD143-U5_062
Report of the Secretary of Agriculture in relation to the forests, rivers, and mountains of the southern Appalachian region
HL_SD143-U5_062_L_a
Report of the Secretary of Agriculture in relation to the forests, rivers, and mountains of the southern Appalachian region
HL_SD143-U5_062_L_b
Report of the Secretary of Agriculture in relation to the forests, rivers, and mountains of the southern Appalachian region
HL_SD143-U5_062_LI_a
Report of the Secretary of Agriculture in relation to the forests, rivers, and mountains of the southern Appalachian region
HL_SD143-U5_062_LI_b
Report of the Secretary of Agriculture in relation to the forests, rivers, and mountains of the southern Appalachian region
HL_SD143-U5_063
Report of the Secretary of Agriculture in relation to the forests, rivers, and mountains of the southern Appalachian region
HL_SD143-U5_064
Report of the Secretary of Agriculture in relation to the forests, rivers, and mountains of the southern Appalachian region
HL_SD143-U5_064_LII_a
Report of the Secretary of Agriculture in relation to the forests, rivers, and mountains of the southern Appalachian region
HL_SD143-U5_064_LII_b
Report of the Secretary of Agriculture in relation to the forests, rivers, and mountains of the southern Appalachian region
HL_SD143-U5_064_LIII_a
Report of the Secretary of Agriculture in relation to the forests, rivers, and mountains of the southern Appalachian region
HL_SD143-U5_064_LIII_b
Report of the Secretary of Agriculture in relation to the forests, rivers, and mountains of the southern Appalachian region
HL_SD143-U5_064_LIV_a
Report of the Secretary of Agriculture in relation to the forests, rivers, and mountains of the southern Appalachian region
HL_SD143-U5_064_LIV_b
Report of the Secretary of Agriculture in relation to the forests, rivers, and mountains of the southern Appalachian region
HL_SD143-U5_065
Report of the Secretary of Agriculture in relation to the forests, rivers, and mountains of the southern Appalachian region
HL_SD143-U5_066
Report of the Secretary of Agriculture in relation to the forests, rivers, and mountains of the southern Appalachian region
HL_SD143-U5_067
Report of the Secretary of Agriculture in relation to the forests, rivers, and mountains of the southern Appalachian region
HL_SD143-U5_068
Report of the Secretary of Agriculture in relation to the forests, rivers, and mountains of the southern Appalachian region
HL_SD143-U5_068_LV_a
Report of the Secretary of Agriculture in relation to the forests, rivers, and mountains of the southern Appalachian region
HL_SD143-U5_068_LV_b
Report of the Secretary of Agriculture in relation to the forests, rivers, and mountains of the southern Appalachian region
HL_SD143-U5_069
Report of the Secretary of Agriculture in relation to the forests, rivers, and mountains of the southern Appalachian region
HL_SD143-U5_070
Report of the Secretary of Agriculture in relation to the forests, rivers, and mountains of the southern Appalachian region
HL_SD143-U5_071
Report of the Secretary of Agriculture in relation to the forests, rivers, and mountains of the southern Appalachian region
HL_SD143-U5_072
Report of the Secretary of Agriculture in relation to the forests, rivers, and mountains of the southern Appalachian region
HL_SD143-U5_073
Report of the Secretary of Agriculture in relation to the forests, rivers, and mountains of the southern Appalachian region
HL_SD143-U5_074
Report of the Secretary of Agriculture in relation to the forests, rivers, and mountains of the southern Appalachian region
HL_SD143-U5_075
Report of the Secretary of Agriculture in relation to the forests, rivers, and mountains of the southern Appalachian region
HL_SD143-U5_076
Report of the Secretary of Agriculture in relation to the forests, rivers, and mountains of the southern Appalachian region
HL_SD143-U5_077
Report of the Secretary of Agriculture in relation to the forests, rivers, and mountains of the southern Appalachian region
HL_SD143-U5_078
Report of the Secretary of Agriculture in relation to the forests, rivers, and mountains of the southern Appalachian region
HL_SD143-U5_079
Report of the Secretary of Agriculture in relation to the forests, rivers, and mountains of the southern Appalachian region
HL_SD143-U5_080
Report of the Secretary of Agriculture in relation to the forests, rivers, and mountains of the southern Appalachian region
HL_SD143-U5_080_LVI_a
Report of the Secretary of Agriculture in relation to the forests, rivers, and mountains of the southern Appalachian region
HL_SD143-U5_080_LVI_b
Report of the Secretary of Agriculture in relation to the forests, rivers, and mountains of the southern Appalachian region
HL_SD143-U5_081
Report of the Secretary of Agriculture in relation to the forests, rivers, and mountains of the southern Appalachian region
HL_SD143-U5_082
Report of the Secretary of Agriculture in relation to the forests, rivers, and mountains of the southern Appalachian region
HL_SD143-U5_083
Report of the Secretary of Agriculture in relation to the forests, rivers, and mountains of the southern Appalachian region
HL_SD143-U5_084
Report of the Secretary of Agriculture in relation to the forests, rivers, and mountains of the southern Appalachian region
HL_SD143-U5_085
Report of the Secretary of Agriculture in relation to the forests, rivers, and mountains of the southern Appalachian region
HL_SD143-U5_086
Report of the Secretary of Agriculture in relation to the forests, rivers, and mountains of the southern Appalachian region
HL_SD143-U5_087
Report of the Secretary of Agriculture in relation to the forests, rivers, and mountains of the southern Appalachian region
HL_SD143-U5_088
Report of the Secretary of Agriculture in relation to the forests, rivers, and mountains of the southern Appalachian region
HL_SD143-U5_088_LVII_a
Report of the Secretary of Agriculture in relation to the forests, rivers, and mountains of the southern Appalachian region
HL_SD143-U5_088_LVII_b
Report of the Secretary of Agriculture in relation to the forests, rivers, and mountains of the southern Appalachian region
HL_SD143-U5_089
Report of the Secretary of Agriculture in relation to the forests, rivers, and mountains of the southern Appalachian region
HL_SD143-U5_090
Report of the Secretary of Agriculture in relation to the forests, rivers, and mountains of the southern Appalachian region
HL_SD143-U5_091
Report of the Secretary of Agriculture in relation to the forests, rivers, and mountains of the southern Appalachian region
HL_SD143-U5_092
Report of the Secretary of Agriculture in relation to the forests, rivers, and mountains of the southern Appalachian region
HL_SD143-U5_093
Report of the Secretary of Agriculture in relation to the forests, rivers, and mountains of the southern Appalachian region
HL_SD143-U5_094
Report of the Secretary of Agriculture in relation to the forests, rivers, and mountains of the southern Appalachian region
HL_SD143-U5_095
Report of the Secretary of Agriculture in relation to the forests, rivers, and mountains of the southern Appalachian region
HL_SD143-U5_096
Report of the Secretary of Agriculture in relation to the forests, rivers, and mountains of the southern Appalachian region
HL_SD143-U5_097
Report of the Secretary of Agriculture in relation to the forests, rivers, and mountains of the southern Appalachian region
HL_SD143-U5_098
Report of the Secretary of Agriculture in relation to the forests, rivers, and mountains of the southern Appalachian region
HL_SD143-U5_099
Report of the Secretary of Agriculture in relation to the forests, rivers, and mountains of the southern Appalachian region
HL_SD143-U5_100
Report of the Secretary of Agriculture in relation to the forests, rivers, and mountains of the southern Appalachian region
HL_SD143-U5_101
Report of the Secretary of Agriculture in relation to the forests, rivers, and mountains of the southern Appalachian region
HL_SD143-U5_102
Report of the Secretary of Agriculture in relation to the forests, rivers, and mountains of the southern Appalachian region
HL_SD143-U5_103
Report of the Secretary of Agriculture in relation to the forests, rivers, and mountains of the southern Appalachian region
HL_SD143-U5_104
Report of the Secretary of Agriculture in relation to the forests, rivers, and mountains of the southern Appalachian region
HL_SD143-U5_105
Report of the Secretary of Agriculture in relation to the forests, rivers, and mountains of the southern Appalachian region
HL_SD143-U5_106
Report of the Secretary of Agriculture in relation to the forests, rivers, and mountains of the southern Appalachian region
HL_SD143-U5_107
Report of the Secretary of Agriculture in relation to the forests, rivers, and mountains of the southern Appalachian region
HL_SD143-U5_108
Report of the Secretary of Agriculture in relation to the forests, rivers, and mountains of the southern Appalachian region
HL_SD143-U5_109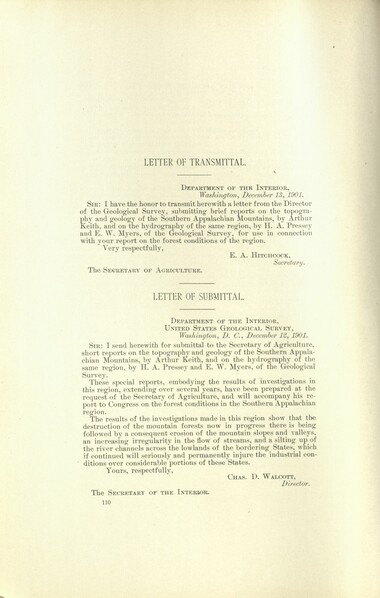
Report of the Secretary of Agriculture in relation to the forests, rivers, and mountains of the southern Appalachian region
HL_SD143-U5_110
Report of the Secretary of Agriculture in relation to the forests, rivers, and mountains of the southern Appalachian region
HL_SD143-U5_111
Report of the Secretary of Agriculture in relation to the forests, rivers, and mountains of the southern Appalachian region
HL_SD143-U5_112
Report of the Secretary of Agriculture in relation to the forests, rivers, and mountains of the southern Appalachian region
HL_SD143-U5_113
Report of the Secretary of Agriculture in relation to the forests, rivers, and mountains of the southern Appalachian region
HL_SD143-U5_114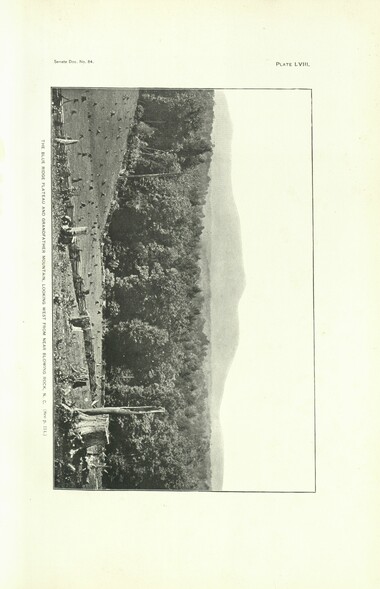
Report of the Secretary of Agriculture in relation to the forests, rivers, and mountains of the southern Appalachian region
HL_SD143-U5_114_LVIII_a
Report of the Secretary of Agriculture in relation to the forests, rivers, and mountains of the southern Appalachian region
HL_SD143-U5_114_LVIII_b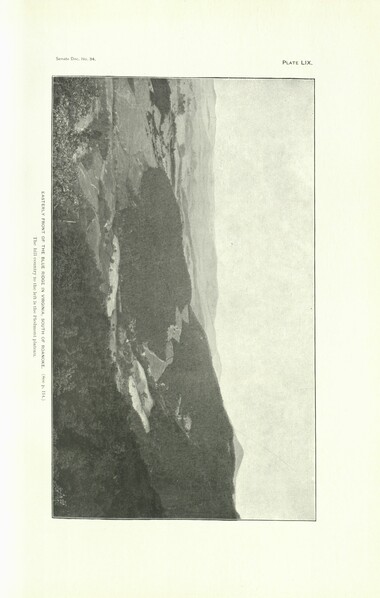
Report of the Secretary of Agriculture in relation to the forests, rivers, and mountains of the southern Appalachian region
HL_SD143-U5_114_LIX_a
Report of the Secretary of Agriculture in relation to the forests, rivers, and mountains of the southern Appalachian region
HL_SD143-U5_114_LIX_b
Report of the Secretary of Agriculture in relation to the forests, rivers, and mountains of the southern Appalachian region
HL_SD143-U5_115
Report of the Secretary of Agriculture in relation to the forests, rivers, and mountains of the southern Appalachian region
HL_SD143-U5_116
Report of the Secretary of Agriculture in relation to the forests, rivers, and mountains of the southern Appalachian region
HL_SD143-U5_116_LX_a
Report of the Secretary of Agriculture in relation to the forests, rivers, and mountains of the southern Appalachian region
HL_SD143-U5_116_LX_b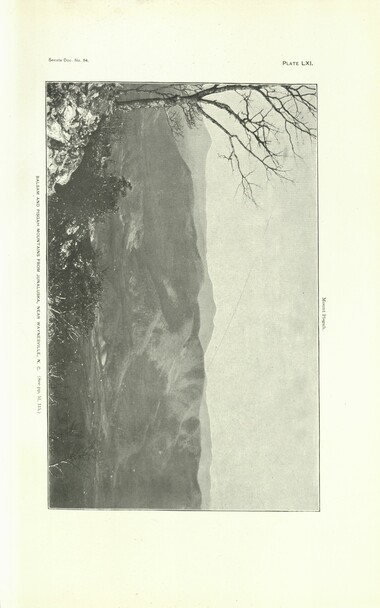
Report of the Secretary of Agriculture in relation to the forests, rivers, and mountains of the southern Appalachian region
HL_SD143-U5_116_LXI_a
Report of the Secretary of Agriculture in relation to the forests, rivers, and mountains of the southern Appalachian region
HL_SD143-U5_116_LXI_b
Report of the Secretary of Agriculture in relation to the forests, rivers, and mountains of the southern Appalachian region
HL_SD143-U5_116_LXII_a
Report of the Secretary of Agriculture in relation to the forests, rivers, and mountains of the southern Appalachian region
HL_SD143-U5_116_LXII_b
Report of the Secretary of Agriculture in relation to the forests, rivers, and mountains of the southern Appalachian region
HL_SD143-U5_116_LXIII_a
Report of the Secretary of Agriculture in relation to the forests, rivers, and mountains of the southern Appalachian region
HL_SD143-U5_116_LXIII_b
Report of the Secretary of Agriculture in relation to the forests, rivers, and mountains of the southern Appalachian region
HL_SD143-U5_117
Report of the Secretary of Agriculture in relation to the forests, rivers, and mountains of the southern Appalachian region
HL_SD143-U5_118
Report of the Secretary of Agriculture in relation to the forests, rivers, and mountains of the southern Appalachian region
HL_SD143-U5_118_LXIV_a
Report of the Secretary of Agriculture in relation to the forests, rivers, and mountains of the southern Appalachian region
HL_SD143-U5_118_LXIV_b
Report of the Secretary of Agriculture in relation to the forests, rivers, and mountains of the southern Appalachian region
HL_SD143-U5_119
Report of the Secretary of Agriculture in relation to the forests, rivers, and mountains of the southern Appalachian region
HL_SD143-U5_120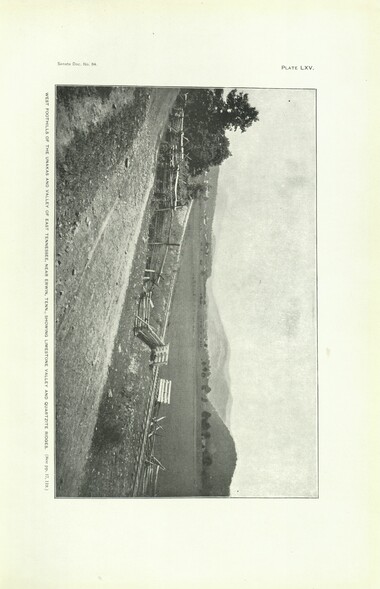
Report of the Secretary of Agriculture in relation to the forests, rivers, and mountains of the southern Appalachian region
HL_SD143-U5_120_LXV_a
Report of the Secretary of Agriculture in relation to the forests, rivers, and mountains of the southern Appalachian region
HL_SD143-U5_120_LXV_b
Report of the Secretary of Agriculture in relation to the forests, rivers, and mountains of the southern Appalachian region
HL_SD143-U5_121
Report of the Secretary of Agriculture in relation to the forests, rivers, and mountains of the southern Appalachian region
HL_SD143-U5_122
Report of the Secretary of Agriculture in relation to the forests, rivers, and mountains of the southern Appalachian region
HL_SD143-U5_122_LXVI_a
Report of the Secretary of Agriculture in relation to the forests, rivers, and mountains of the southern Appalachian region
HL_SD143-U5_122_LXVI_b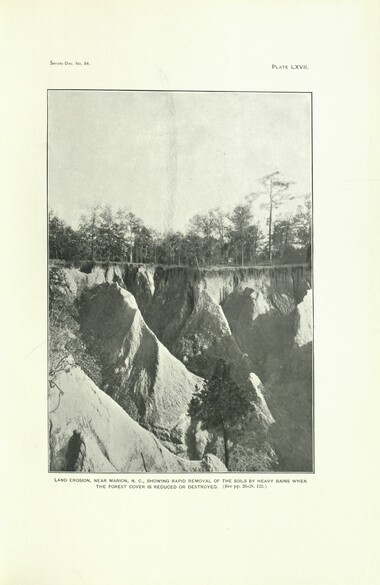
Report of the Secretary of Agriculture in relation to the forests, rivers, and mountains of the southern Appalachian region
HL_SD143-U5_122_LXVII_a
Report of the Secretary of Agriculture in relation to the forests, rivers, and mountains of the southern Appalachian region
HL_SD143-U5_122_LXVII_b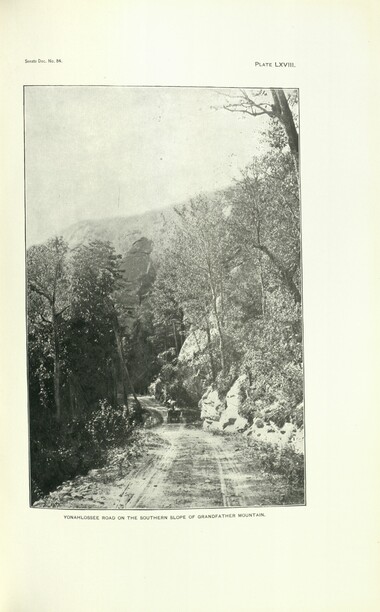
Report of the Secretary of Agriculture in relation to the forests, rivers, and mountains of the southern Appalachian region
HL_SD143-U5_122_LXVIII_a
Report of the Secretary of Agriculture in relation to the forests, rivers, and mountains of the southern Appalachian region
HL_SD143-U5_122_LXVIII_b
Report of the Secretary of Agriculture in relation to the forests, rivers, and mountains of the southern Appalachian region
HL_SD143-U5_123
Report of the Secretary of Agriculture in relation to the forests, rivers, and mountains of the southern Appalachian region
HL_SD143-U5_124
Report of the Secretary of Agriculture in relation to the forests, rivers, and mountains of the southern Appalachian region
HL_SD143-U5_125
Report of the Secretary of Agriculture in relation to the forests, rivers, and mountains of the southern Appalachian region
HL_SD143-U5_126
Report of the Secretary of Agriculture in relation to the forests, rivers, and mountains of the southern Appalachian region
HL_SD143-U5_126_LXVIX_a
Report of the Secretary of Agriculture in relation to the forests, rivers, and mountains of the southern Appalachian region
HL_SD143-U5_126_LXVIX_b
Report of the Secretary of Agriculture in relation to the forests, rivers, and mountains of the southern Appalachian region
HL_SD143-U5_126_LXX_a
Report of the Secretary of Agriculture in relation to the forests, rivers, and mountains of the southern Appalachian region
HL_SD143-U5_126_LXX_b
Report of the Secretary of Agriculture in relation to the forests, rivers, and mountains of the southern Appalachian region
HL_SD143-U5_126_LXXI_a
Report of the Secretary of Agriculture in relation to the forests, rivers, and mountains of the southern Appalachian region
HL_SD143-U5_126_LXXI_b
Report of the Secretary of Agriculture in relation to the forests, rivers, and mountains of the southern Appalachian region
HL_SD143-U5_127
Report of the Secretary of Agriculture in relation to the forests, rivers, and mountains of the southern Appalachian region
HL_SD143-U5_128
Report of the Secretary of Agriculture in relation to the forests, rivers, and mountains of the southern Appalachian region
HL_SD143-U5_128_LXXII_a
Report of the Secretary of Agriculture in relation to the forests, rivers, and mountains of the southern Appalachian region
HL_SD143-U5_128_LXXII_b
Report of the Secretary of Agriculture in relation to the forests, rivers, and mountains of the southern Appalachian region
HL_SD143-U5_128_LXXIII_a
Report of the Secretary of Agriculture in relation to the forests, rivers, and mountains of the southern Appalachian region
HL_SD143-U5_128_LXXIII_b
Report of the Secretary of Agriculture in relation to the forests, rivers, and mountains of the southern Appalachian region
HL_SD143-U5_129
Report of the Secretary of Agriculture in relation to the forests, rivers, and mountains of the southern Appalachian region
HL_SD143-U5_130
Report of the Secretary of Agriculture in relation to the forests, rivers, and mountains of the southern Appalachian region
HL_SD143-U5_130_LXXIV_a
Report of the Secretary of Agriculture in relation to the forests, rivers, and mountains of the southern Appalachian region
HL_SD143-U5_130_LXXIV_b
Report of the Secretary of Agriculture in relation to the forests, rivers, and mountains of the southern Appalachian region
HL_SD143-U5_130_LXXV_a
Report of the Secretary of Agriculture in relation to the forests, rivers, and mountains of the southern Appalachian region
HL_SD143-U5_130_LXXV_b
Report of the Secretary of Agriculture in relation to the forests, rivers, and mountains of the southern Appalachian region
HL_SD143-U5_130_LXXVI_a
Report of the Secretary of Agriculture in relation to the forests, rivers, and mountains of the southern Appalachian region
HL_SD143-U5_130_LXXVI_b
Report of the Secretary of Agriculture in relation to the forests, rivers, and mountains of the southern Appalachian region
HL_SD143-U5_130_LXXVII_a
Report of the Secretary of Agriculture in relation to the forests, rivers, and mountains of the southern Appalachian region
HL_SD143-U5_130_LXXVII_b
Report of the Secretary of Agriculture in relation to the forests, rivers, and mountains of the southern Appalachian region
HL_SD143-U5_131
Report of the Secretary of Agriculture in relation to the forests, rivers, and mountains of the southern Appalachian region
HL_SD143-U5_132
Report of the Secretary of Agriculture in relation to the forests, rivers, and mountains of the southern Appalachian region
HL_SD143-U5_133
Report of the Secretary of Agriculture in relation to the forests, rivers, and mountains of the southern Appalachian region
HL_SD143-U5_134
Report of the Secretary of Agriculture in relation to the forests, rivers, and mountains of the southern Appalachian region
HL_SD143-U5_135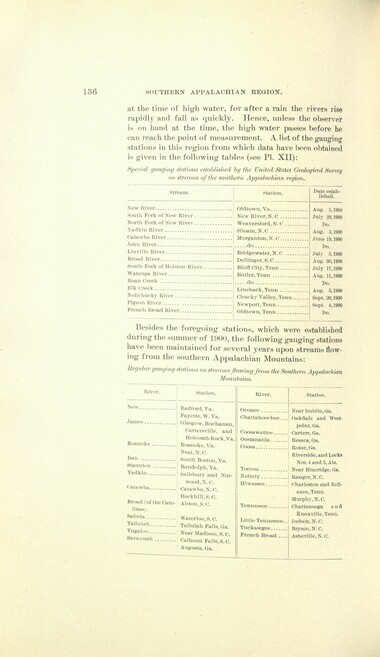
Report of the Secretary of Agriculture in relation to the forests, rivers, and mountains of the southern Appalachian region
HL_SD143-U5_136
Report of the Secretary of Agriculture in relation to the forests, rivers, and mountains of the southern Appalachian region
HL_SD143-U5_137
Report of the Secretary of Agriculture in relation to the forests, rivers, and mountains of the southern Appalachian region
HL_SD143-U5_138
Report of the Secretary of Agriculture in relation to the forests, rivers, and mountains of the southern Appalachian region
HL_SD143-U5_138_LXXVIII_a
Report of the Secretary of Agriculture in relation to the forests, rivers, and mountains of the southern Appalachian region
HL_SD143-U5_138_LXXVIII_b
Report of the Secretary of Agriculture in relation to the forests, rivers, and mountains of the southern Appalachian region
HL_SD143-U5_139
Report of the Secretary of Agriculture in relation to the forests, rivers, and mountains of the southern Appalachian region
HL_SD143-U5_140
Report of the Secretary of Agriculture in relation to the forests, rivers, and mountains of the southern Appalachian region
HL_SD143-U5_141
Report of the Secretary of Agriculture in relation to the forests, rivers, and mountains of the southern Appalachian region
HL_SD143-U5_142
Report of the Secretary of Agriculture in relation to the forests, rivers, and mountains of the southern Appalachian region
HL_SD143-U5_143
Report of the Secretary of Agriculture in relation to the forests, rivers, and mountains of the southern Appalachian region
HL_SD143-U5_144
Report of the Secretary of Agriculture in relation to the forests, rivers, and mountains of the southern Appalachian region
HL_SD143-U5_145
Report of the Secretary of Agriculture in relation to the forests, rivers, and mountains of the southern Appalachian region
HL_SD143-U5_146
Report of the Secretary of Agriculture in relation to the forests, rivers, and mountains of the southern Appalachian region
HL_SD143-U5_147
Report of the Secretary of Agriculture in relation to the forests, rivers, and mountains of the southern Appalachian region
HL_SD143-U5_148
Report of the Secretary of Agriculture in relation to the forests, rivers, and mountains of the southern Appalachian region
HL_SD143-U5_149
Report of the Secretary of Agriculture in relation to the forests, rivers, and mountains of the southern Appalachian region
HL_SD143-U5_150
Report of the Secretary of Agriculture in relation to the forests, rivers, and mountains of the southern Appalachian region
HL_SD143-U5_151
Report of the Secretary of Agriculture in relation to the forests, rivers, and mountains of the southern Appalachian region
HL_SD143-U5_152
Report of the Secretary of Agriculture in relation to the forests, rivers, and mountains of the southern Appalachian region
HL_SD143-U5_153
Report of the Secretary of Agriculture in relation to the forests, rivers, and mountains of the southern Appalachian region
HL_SD143-U5_154
Report of the Secretary of Agriculture in relation to the forests, rivers, and mountains of the southern Appalachian region
HL_SD143-U5_155
Report of the Secretary of Agriculture in relation to the forests, rivers, and mountains of the southern Appalachian region
HL_SD143-U5_156
Report of the Secretary of Agriculture in relation to the forests, rivers, and mountains of the southern Appalachian region
HL_SD143-U5_157
Report of the Secretary of Agriculture in relation to the forests, rivers, and mountains of the southern Appalachian region
HL_SD143-U5_158
Report of the Secretary of Agriculture in relation to the forests, rivers, and mountains of the southern Appalachian region
HL_SD143-U5_159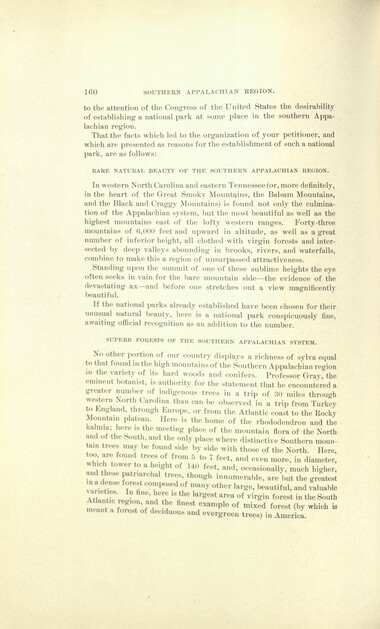
Report of the Secretary of Agriculture in relation to the forests, rivers, and mountains of the southern Appalachian region
HL_SD143-U5_160
Report of the Secretary of Agriculture in relation to the forests, rivers, and mountains of the southern Appalachian region
HL_SD143-U5_161
Report of the Secretary of Agriculture in relation to the forests, rivers, and mountains of the southern Appalachian region
HL_SD143-U5_162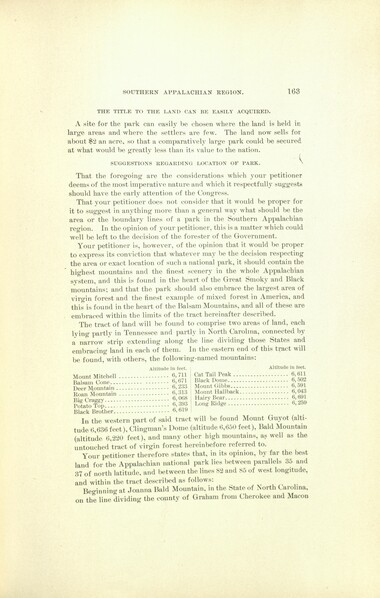
Report of the Secretary of Agriculture in relation to the forests, rivers, and mountains of the southern Appalachian region
HL_SD143-U5_163
Report of the Secretary of Agriculture in relation to the forests, rivers, and mountains of the southern Appalachian region
HL_SD143-U5_164
Report of the Secretary of Agriculture in relation to the forests, rivers, and mountains of the southern Appalachian region
HL_SD143-U5_165
Report of the Secretary of Agriculture in relation to the forests, rivers, and mountains of the southern Appalachian region
HL_SD143-U5_166
Report of the Secretary of Agriculture in relation to the forests, rivers, and mountains of the southern Appalachian region
HL_SD143-U5_167
Report of the Secretary of Agriculture in relation to the forests, rivers, and mountains of the southern Appalachian region
HL_SD143-U5_168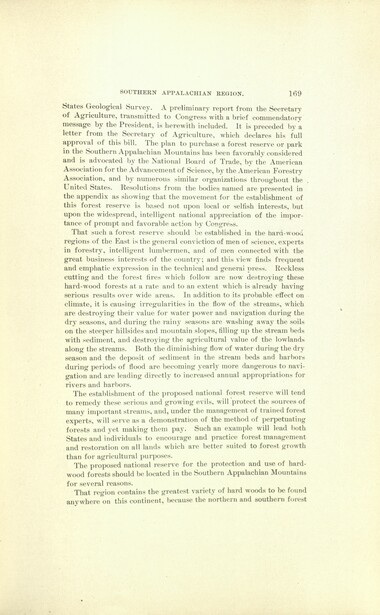
Report of the Secretary of Agriculture in relation to the forests, rivers, and mountains of the southern Appalachian region
HL_SD143-U5_169
Report of the Secretary of Agriculture in relation to the forests, rivers, and mountains of the southern Appalachian region
HL_SD143-U5_170
Report of the Secretary of Agriculture in relation to the forests, rivers, and mountains of the southern Appalachian region
HL_SD143-U5_171
Report of the Secretary of Agriculture in relation to the forests, rivers, and mountains of the southern Appalachian region
HL_SD143-U5_172
Report of the Secretary of Agriculture in relation to the forests, rivers, and mountains of the southern Appalachian region
HL_SD143-U5_173
Report of the Secretary of Agriculture in relation to the forests, rivers, and mountains of the southern Appalachian region
HL_SD143-U5_174
Report of the Secretary of Agriculture in relation to the forests, rivers, and mountains of the southern Appalachian region
HL_SD143-U5_175
Report of the Secretary of Agriculture in relation to the forests, rivers, and mountains of the southern Appalachian region
HL_SD143-U5_176
Report of the Secretary of Agriculture in relation to the forests, rivers, and mountains of the southern Appalachian region
HL_SD143-U5_177
Report of the Secretary of Agriculture in relation to the forests, rivers, and mountains of the southern Appalachian region
HL_SD143-U5_178
Report of the Secretary of Agriculture in relation to the forests, rivers, and mountains of the southern Appalachian region
HL_SD143-U5_179
Report of the Secretary of Agriculture in relation to the forests, rivers, and mountains of the southern Appalachian region
HL_SD143-U5_180
Report of the Secretary of Agriculture in relation to the forests, rivers, and mountains of the southern Appalachian region
HL_SD143-U5_181
Report of the Secretary of Agriculture in relation to the forests, rivers, and mountains of the southern Appalachian region
HL_SD143-U5_182
Report of the Secretary of Agriculture in relation to the forests, rivers, and mountains of the southern Appalachian region
HL_SD143-U5_183
Report of the Secretary of Agriculture in relation to the forests, rivers, and mountains of the southern Appalachian region
HL_SD143-U5_184
Report of the Secretary of Agriculture in relation to the forests, rivers, and mountains of the southern Appalachian region
HL_SD143-U5_185
Report of the Secretary of Agriculture in relation to the forests, rivers, and mountains of the southern Appalachian region
HL_SD143-U5_186
Report of the Secretary of Agriculture in relation to the forests, rivers, and mountains of the southern Appalachian region
HL_SD143-U5_187
Report of the Secretary of Agriculture in relation to the forests, rivers, and mountains of the southern Appalachian region
HL_SD143-U5_188
Report of the Secretary of Agriculture in relation to the forests, rivers, and mountains of the southern Appalachian region
HL_SD143-U5_189
Report of the Secretary of Agriculture in relation to the forests, rivers, and mountains of the southern Appalachian region
HL_SD143-U5_190
Report of the Secretary of Agriculture in relation to the forests, rivers, and mountains of the southern Appalachian region
HL_SD143-U5_191
Report of the Secretary of Agriculture in relation to the forests, rivers, and mountains of the southern Appalachian region
HL_SD143-U5_192
Report of the Secretary of Agriculture in relation to the forests, rivers, and mountains of the southern Appalachian region
HL_SD143-U5_193
Report of the Secretary of Agriculture in relation to the forests, rivers, and mountains of the southern Appalachian region
HL_SD143-U5_194
Report of the Secretary of Agriculture in relation to the forests, rivers, and mountains of the southern Appalachian region
HL_SD143-U5_195
Report of the Secretary of Agriculture in relation to the forests, rivers, and mountains of the southern Appalachian region
HL_SD143-U5_196
Report of the Secretary of Agriculture in relation to the forests, rivers, and mountains of the southern Appalachian region
HL_SD143-U5_197
Report of the Secretary of Agriculture in relation to the forests, rivers, and mountains of the southern Appalachian region
HL_SD143-U5_198
Report of the Secretary of Agriculture in relation to the forests, rivers, and mountains of the southern Appalachian region
HL_SD143-U5_199
Report of the Secretary of Agriculture in relation to the forests, rivers, and mountains of the southern Appalachian region
HL_SD143-U5_200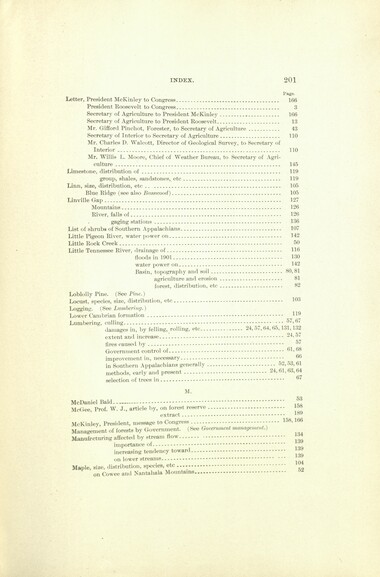
Report of the Secretary of Agriculture in relation to the forests, rivers, and mountains of the southern Appalachian region
HL_SD143-U5_201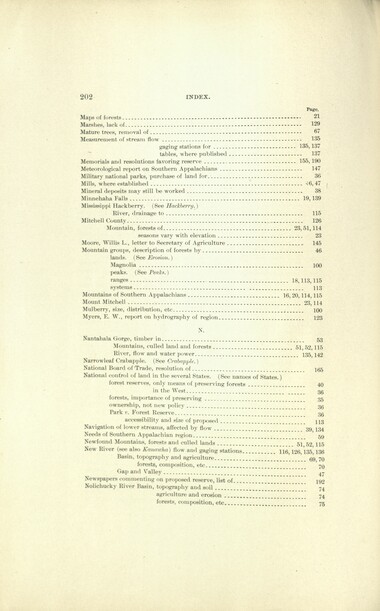
Report of the Secretary of Agriculture in relation to the forests, rivers, and mountains of the southern Appalachian region
HL_SD143-U5_202
Report of the Secretary of Agriculture in relation to the forests, rivers, and mountains of the southern Appalachian region
HL_SD143-U5_203
Report of the Secretary of Agriculture in relation to the forests, rivers, and mountains of the southern Appalachian region
HL_SD143-U5_204
Report of the Secretary of Agriculture in relation to the forests, rivers, and mountains of the southern Appalachian region
HL_SD143-U5_205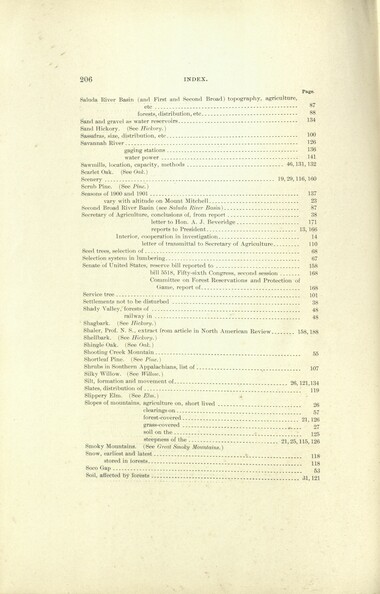
Report of the Secretary of Agriculture in relation to the forests, rivers, and mountains of the southern Appalachian region
HL_SD143-U5_206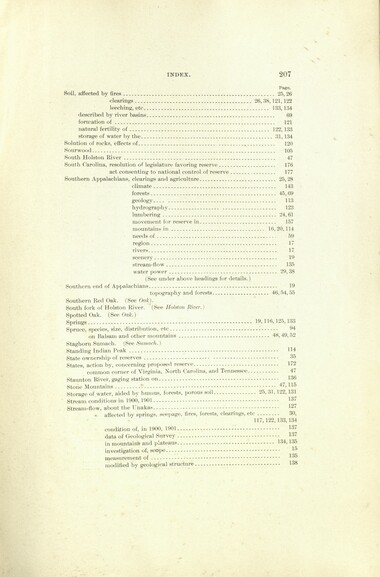
Report of the Secretary of Agriculture in relation to the forests, rivers, and mountains of the southern Appalachian region
HL_SD143-U5_207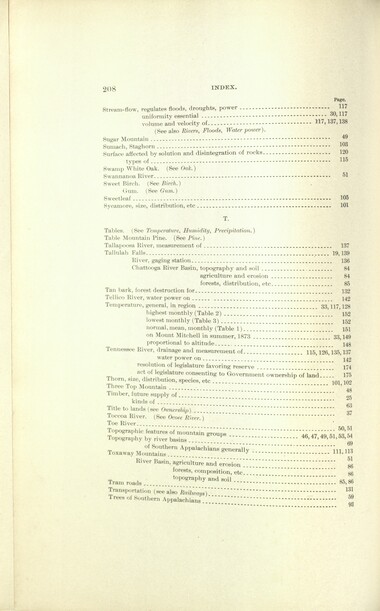
Report of the Secretary of Agriculture in relation to the forests, rivers, and mountains of the southern Appalachian region
HL_SD143-U5_208
Report of the Secretary of Agriculture in relation to the forests, rivers, and mountains of the southern Appalachian region
HL_SD143-U5_209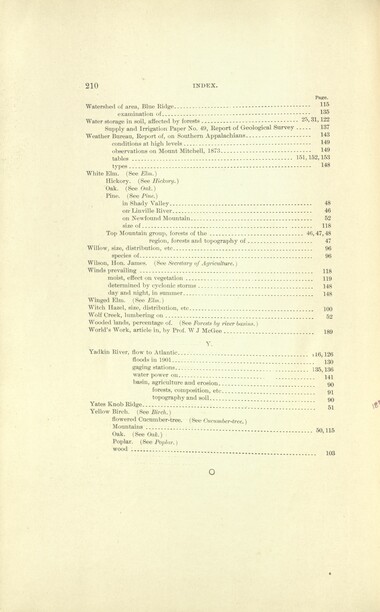
Report of the Secretary of Agriculture in relation to the forests, rivers, and mountains of the southern Appalachian region
HL_SD143-U5_210
Report of the Secretary of Agriculture in relation to the forests, rivers, and mountains of the southern Appalachian region
HL_SD143-U5_211
Report of the Secretary of Agriculture in relation to the forests, rivers, and mountains of the southern Appalachian region
HL_SD143-U5_212
Report of the Secretary of Agriculture in relation to the forests, rivers, and mountains of the southern Appalachian region
HL_SD143-U5_213
Report of the Secretary of Agriculture in relation to the forests, rivers, and mountains of the southern Appalachian region
HL_SD143-U5_214Item’s are ‘child’ level descriptions to ‘parent’ objects, (e.g. one page of a whole book).
-
-
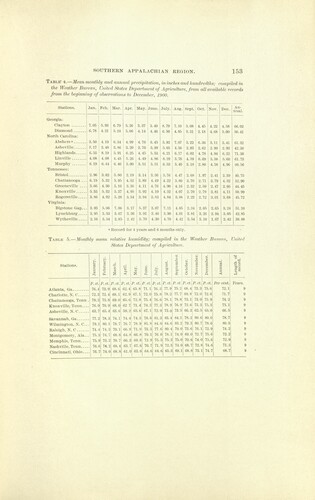
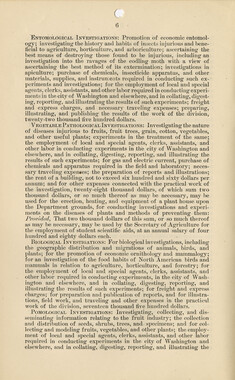
SOUTHERN APPALACHIAN REGION. 153 Table- 4.—Mean monthly and annual precipitation, in inches and hundredths; compiled in the Weather Bureau, United States Department of Agriculture, from all available records from the beginning of observations to December, 1900. Stations. Jan. Feb. Mar. Apr. May. lune. July. Aug. Sept. Oct. Nov. Dec. Annual. Georgia: Clayton 7.05 5.93 6.79 5.26 3.37 3.40 8.79 7.10 5.08 4.45 4.22 4.58 66.02 Diamond 6.78 4.21 5.24 5.06 4.14 ! 4.46 6.50 4.85 3.31 2.18 4.68 5.00 56.41 North Carolina: Abshers a 3.50 4.19 6.34 4.99 4.76 : 6.45 5.92 7.07 5.22 6.36 3.11 3.41 61.32 Asheville 3.17 3.48 3.86 3.20 3.70 3.99 5.05 4.56 2.83 2.62 2.99 2.93 42.38 Highlands 6.53 8.19 5.91 6.25 4.45 5.53 6.21 6.17 6.02 4.78 4.94 6.32 71.30 Linville 4.08 4.08 4.45 5.26 4.49 4.86 8.29 3.76 4.59 6.69 5.58 5. 60 61.73 Murphv 6.19 6.44 6.46 5.00 3. 51 5.51 6.63 5.40 3.18 2.80 4.58 4.96 60.56 Tennessee: Bristol 2.96 3.62 5.80 2.19 3.14 3.36 5.76 4.47 2.68 1.97 2.41 2.39 40.75 Chattanooga ... 6.19 5.32 5.95 4.52 3.89 4.49 4.22 3.80 3.70 2.71 3.79 4.32 52.90 Greeneville — 3.66 4.30 5.16 3.36 4.11 4.76 4.90 4.16 2.32 2.59 2.47 2. 66 44.45 Knoxville 5.53 5.32 5.37 4.95 3.92 4.10 4.32 4.07 2.70 2.79 3.81 4.11 50.99 Rogersville 3.86 4.92 5.28 3.54 3.94 3.83 4.84 3.88 2.22 2.72 3.01 3.68 15.72 Virginia: Bigstonc Gap... 3.93 5.06 7.06 3.17 5.37 3.67 7.11 4.85 2.34 2.65 2.65 3.24 51.10 Lynchburg 3.95 3.53 3.67 3.36 3.91 3.46 3.90 4.01 3.81 3. 26 2.94 3.05 42.85 Wytheville 2.16 3.54 2.85 2.42 3.70 4.30 4.76 4.42 3.54 3.10 1.67 2.42 38.88 » Record for 4 years and 6 months only. Table 5.—Monthly mean relative humidity; compiled in the Weather Bureau, United States Department of Agriculture. Stations Atlanta, Ga Charlotte, N. C Chattanooga, Tenn . Knoxville, Tenn... Asheville, N. C Savannah, Ga Wilmington, N. C Raleigh, N. C Montgomery, Ala.. Memphis, Tenn Nashville, Tenn Cincinnati, Ohio... P.cl. 70.4 72.3 78.2 76.0 63.7 77.2 79.1 74 75.3 75.9 76.6 76.7 P.cl 73.9 72.4 73.8 70.9 65.4 78.3 80.1 74.3 74 73.2 74.2 74.0 a P.ct. 68.6 68.1 69.0 68.0 63.6 74.1 78.7 70.1 68.8 70. 68.4 P.cl 62.4 62. 65.6 62 7 59.2 74.4 76 66.9 64.8 66.3 63.7 61.0 % P.ct. (15. 8 67.1 72. 71.4 65.6 74.3 78. 71.9 66.8 69. 67.6 63.6 P.ct 71.1 72.0 75.4 74.3 78.6 81.8 73.3 70.1 72.9 70. 64.6 P.ct 76.3 75.8 76.6 77.3 72.9 81.3 84.0 77.6 76.0 75.3 71. 64.6 P.ct 77.9 78.2 78.1 78.9 73.0 83.4 84.6 80.4 78.1 75.3 72.3 65.3 P. cl. P. ct 75.2 68.4 77.7 69.8 78.8 73.1 76-9! 72.6 73.5 66.3 84.1 83.2 79.0 74.0 75.0 74.0 69.1 78.2 79.3 7:!. 6 69.0 70.(1 68.7 68.8 y. P.ct 73.3 72.(i 73.0 73. 62.5 80.6 80. 76.1 72.7 74.0 72.8 73.1 P.ct 75.6 72.6 75 75.3 65.0 80.0 78.6 72.9 75.6 75.6 74.6 74.7 Per cent. 72.1 71.7 74.2 73.1 66.5 78.7 80.6 74.2 72.2 72.9 71.3 68.7 5S SCO Years.
Object’s are ‘parent’ level descriptions to ‘children’ items, (e.g. a book with pages).
-
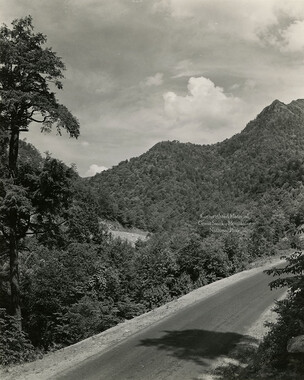
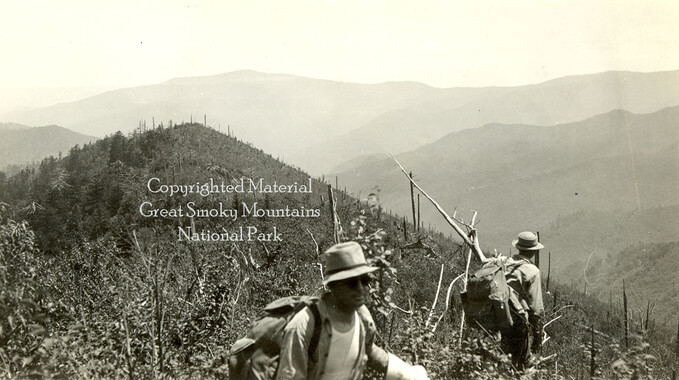
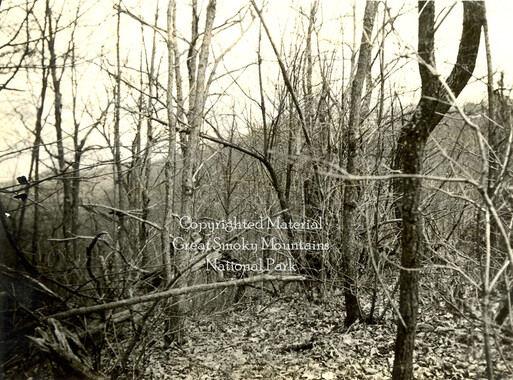
This 386-page report of the Secretary of Agriculture discusses the state of the forests, rivers, and mountains of the southern Appalachians in 1902. Theodore Roosevelt was president at the time. The report is illustrated with many photographs and fold out maps that are uploaded into this collection separately.
-
Related items
-
Cullowhee Yodel Volume 08 Number 04

-
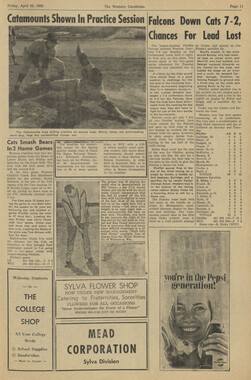
Western Carolinian Volume 67 Number 10

-
National Park in the Great Smoky Mountains

-
Road Laws of Swain County, 1923
-
Western Carolinian Volume 18 Number 01

-
Neo-Blackness 1977

-
Memories of District C: Civilian Conservation Corps

-
Western Carolinian Volume 30 Number 12

-
National Parks Bulletin
-
Elsie Watty Basketweaver

-
Western Carolinian Volume 24 Number 09

-
Western Carolinian Volume 33 Number 01

-
Western Carolinian Volume 30 Number 22
-
The Canton Enterprise Volume 22 Number 29
-
Western Carolinian Volume 54 Number 18

-
Western Carolinian Volume 44 Number 31

-
Western Carolinian Volume 45 Number 30
-
Western Carolinian Volume 45 (46) Number 20

-
Western Carolinian Volume 13 Number 06

-
Western Carolinian Volume 52 Number 16

-
Western Carolinian Volume 23 Number 02
-
Western Carolinian Volume 64 (65) Number 25
-
Western Carolinian Volume 44 Number 15

-
Report of the North Carolina Park Commission
-
Western Carolinian Volume 67 Number 04

-
Western Carolinian Volume 46 Number 06, September 25, 1980

-
1932 Weaving Institute at Penland
-
Quarterly Magazine of the Southern Industrial Educational Association pages 24-25

-
Western Carolinian Volume 35 Number 33

-
American Cameo Pottery

-
Western Carolinian Volume 39 Number 15
-
Western Carolinian Volume 64 (65) Number 28
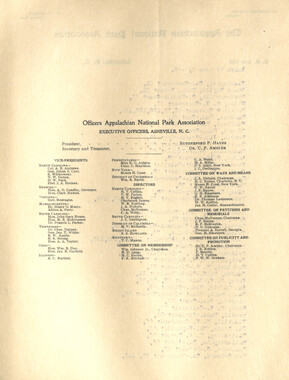
Part of Collection
Great Smoky Mountains - A Park for America
-
Senate Bill 781
-
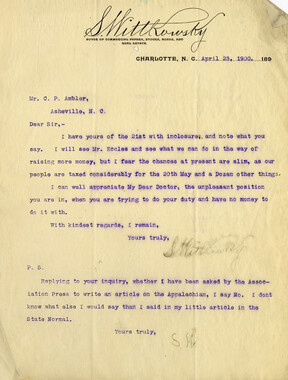
Letters supporting Appalachian National Park movement
-
Appalachian National Park Association Newspaper Clippings, 1899-1902
-
Cataloochee tract 254: W. D. Messer

-
Park dedication: traffic control

-
Correspondence between H. C. Wilburn and Zebulon Weaver, 1933

-
Act making appropriations for the Department of Agriculture
-
Financial receipts and expenditures, 1902

-
Cataloochee tract 215: George H. Caldwell
-
Hikers at Indian Gap

-
Correspondence: M. V. Richards to A. H. McQuilkin

-
Cataloochee tract 226: W. M. Hall
-
Letters supporting Appalachian National Park movement
-
Smokies roadway
-
Report of the Secretary of Agriculture in relation to the forests, rivers, and mountains of the southern Appalachian region

-
Parson Bald and Gregory Bald

-
Hikers on Hell Ridge
-
Cataloochee tract 214: Eldredge Caldwell – Levi

-
Report of the North Carolina Park Commission

-
Common forest trees of North Carolina

-
Cataloochee tract owners

-
Appalachian Trail clearing
-
Virginia creeper

-
Cataloochee tract 292: J. L. C. Messer

-
Santeetlah Dam
-
Appalachian National Park Association Newspaper Clippings, 1899-1902
-
Correspondence to various Boards of Trade
-
Stickers: Push the Appalachian National Park

-
Logging and timber sales in Cherokee

-
Last of the Eastern Wilderness: An Article on the Proposed Great Smoky National Park

-
Subscriptions received by the Appalachian National Park Association
-
Mountain landscape looking eastward
